Strategy
Part of Getting Small Business Marketing Strategy Right the First Time
8 Things to Check Before Trusting Small Business Marketing Benchmarks
Eight checks that tell a small business owner whether a marketing benchmark describes their customers, their costs, their sales cycle and their capacity.
What to take away
- Small business marketing benchmarks are worth keeping only when one changes an offer, a follow-up step, a capacity limit, a channel role or a budget line.
- Google Analytics benchmarking compares you with a peer group the platform defines, not with your industry.
- Pair every acquisition number with contribution, repeat behavior, response time and delivery capacity.
- Build the baseline from at least one full sales cycle, then mark promotions, outages and seasonality on it.
- When a figure is missing, write the arithmetic in your own variables instead of borrowing a stranger's average.
1. Check the peer group before the number
Google Analytics benchmarking compares an eligible property against a peer group Google defines, then reports percentiles. Its documentation lists which properties qualify, the privacy thresholds applied, which metrics exist, and how far back the dates run.
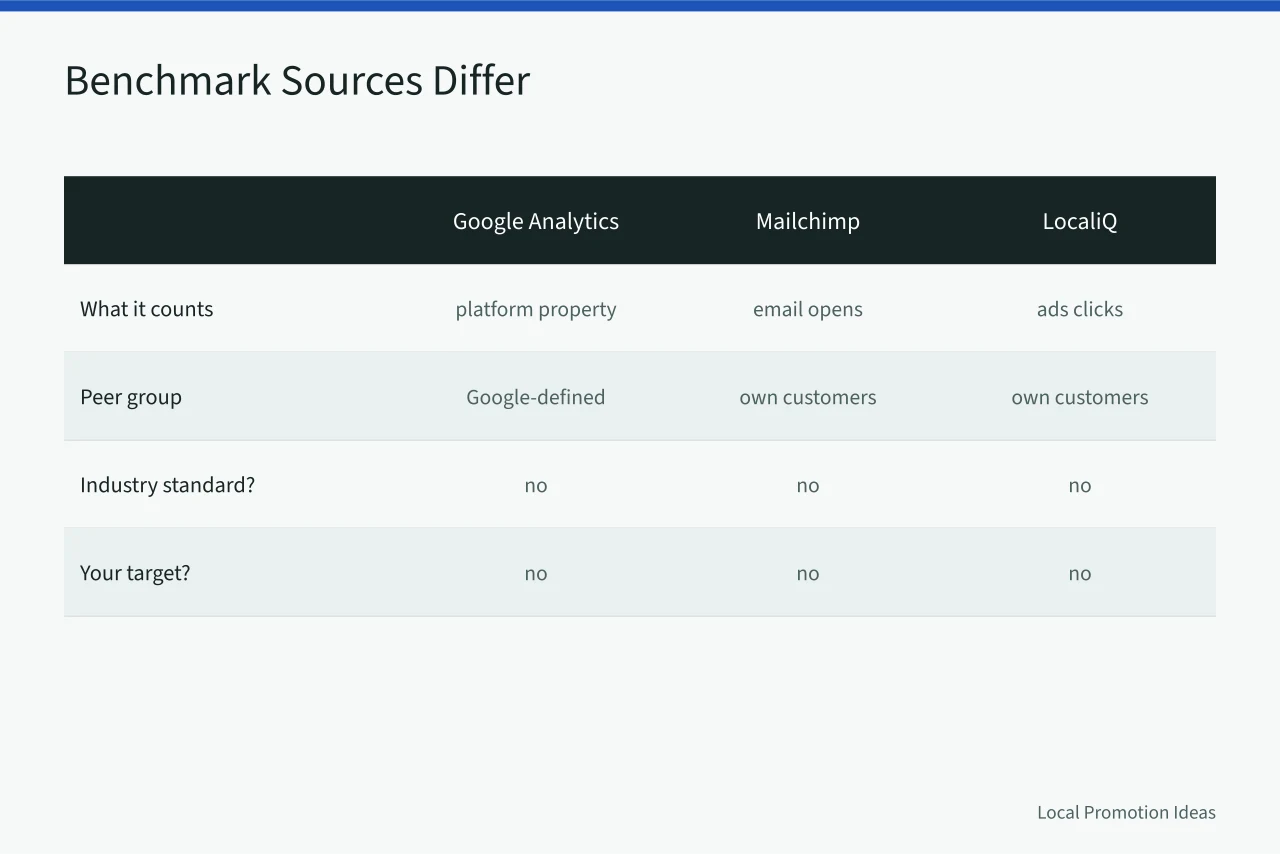
That is a dated platform comparison. It is not an industry standard and not your target. Read the eligibility notes first, because a peer group you cannot describe is one you cannot act on.
Published benchmark sets carry the same caveat. Mailchimp reports average open and click rates by industry for its own customers. LocaliQ's Google Ads benchmark report lists average cost per click and conversion rate by industry.
HubSpot surveys marketers on channel mix and budgets. Each one counts a click, a lead or a sale its own way.
2. Check what Google Business Profile numbers actually count
Google Business Profile performance reports several metrics for verified profiles:
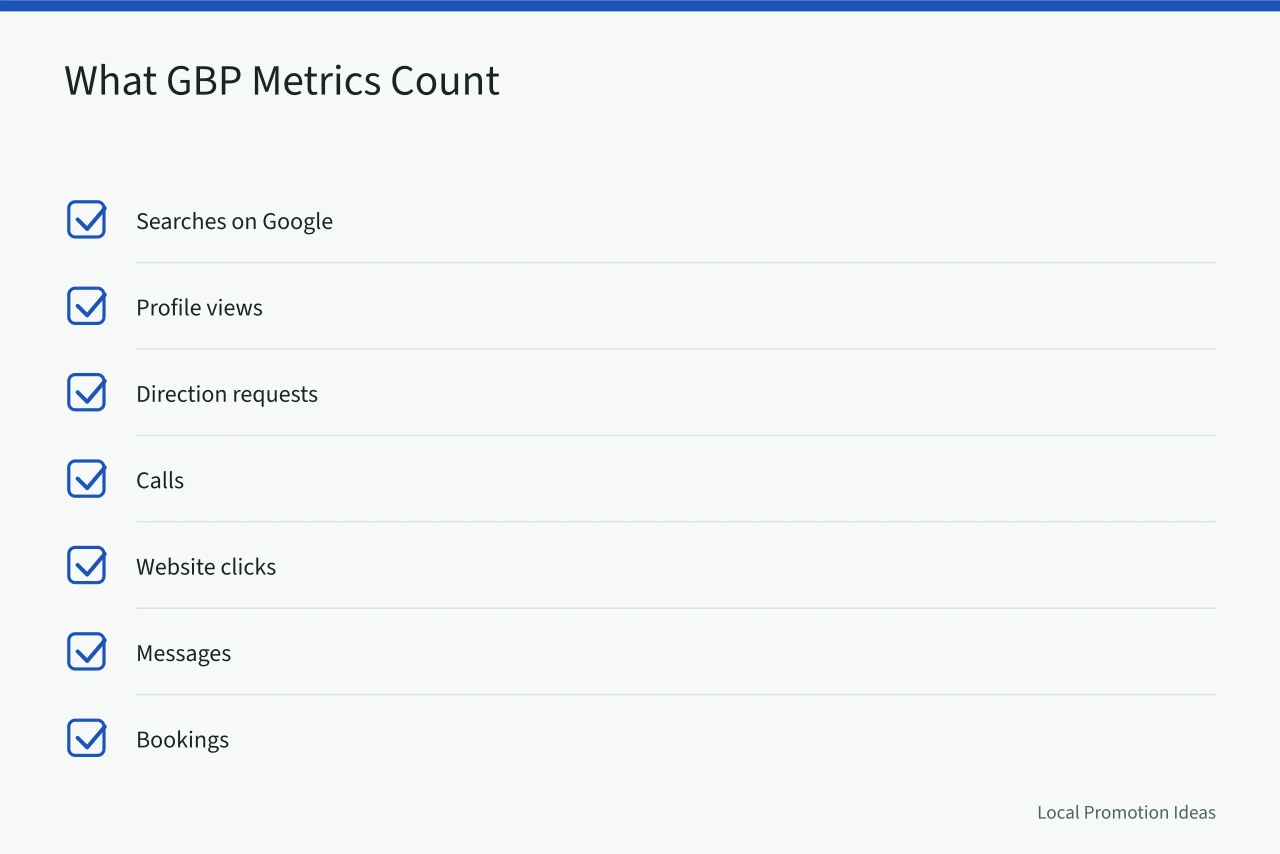
Not every metric appears for every business. These are interactions on Google, not sales, contribution or retention. Reconcile them against your own records before you treat a rise in calls as a rise in customers.
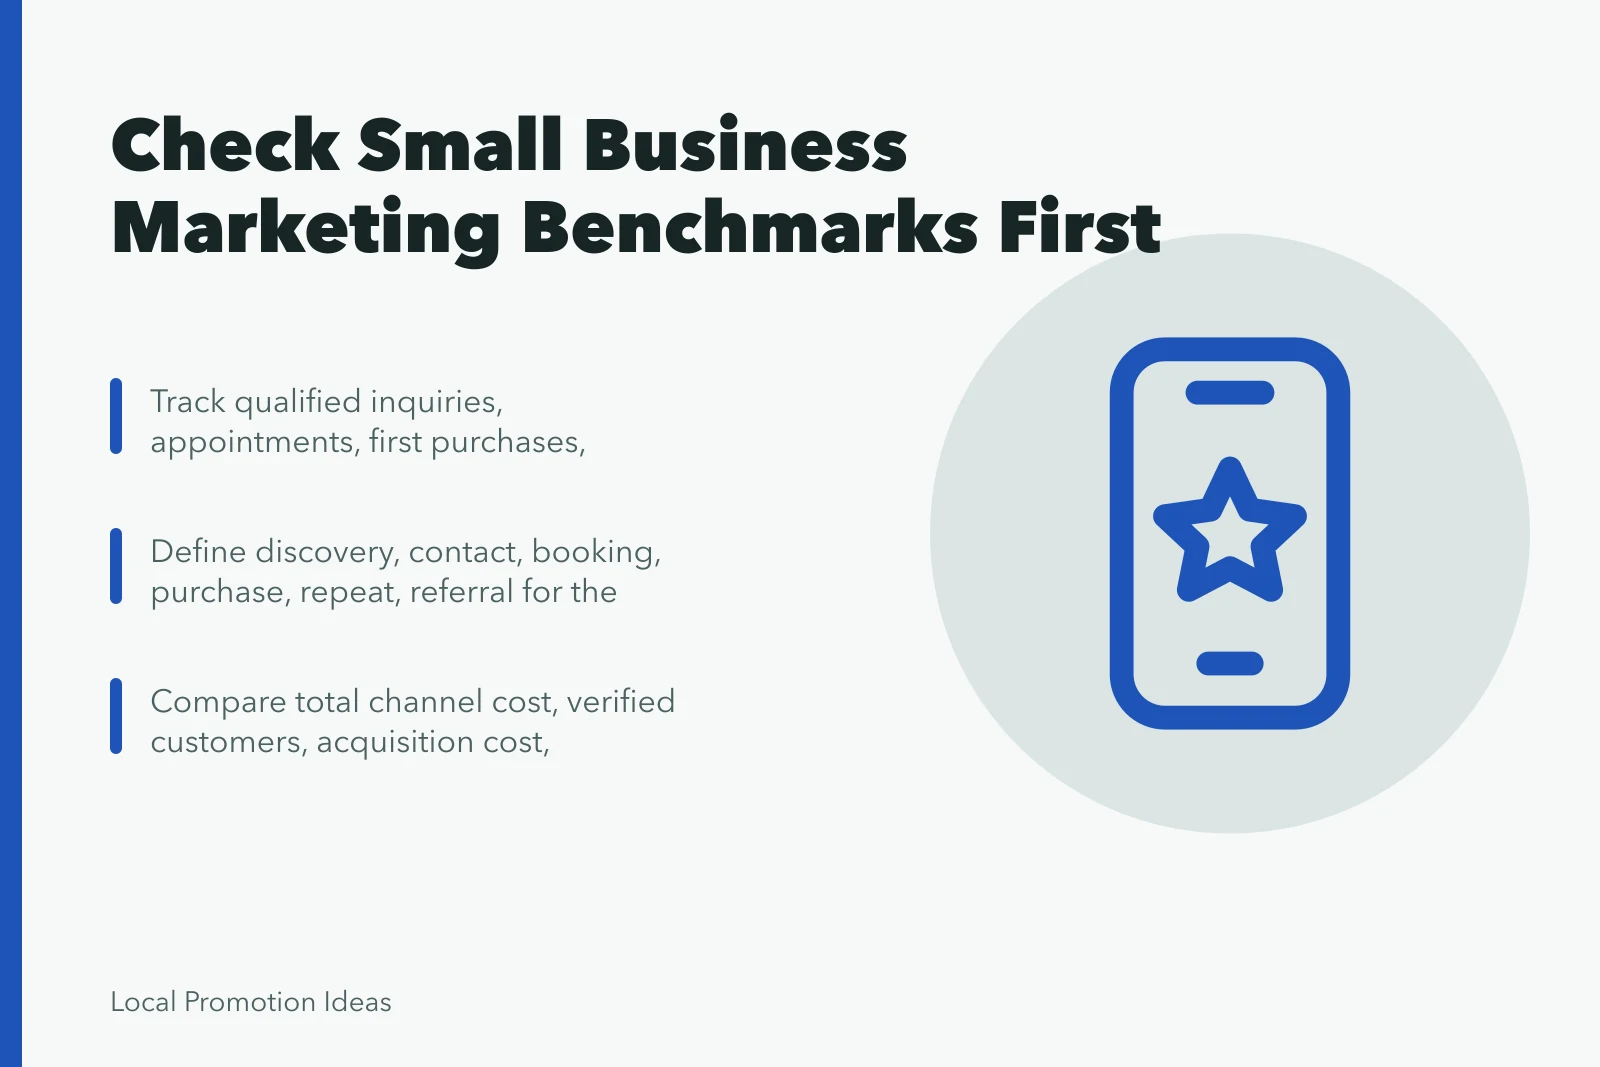
3. Check the customer path stage by stage
Write the stages for your business:
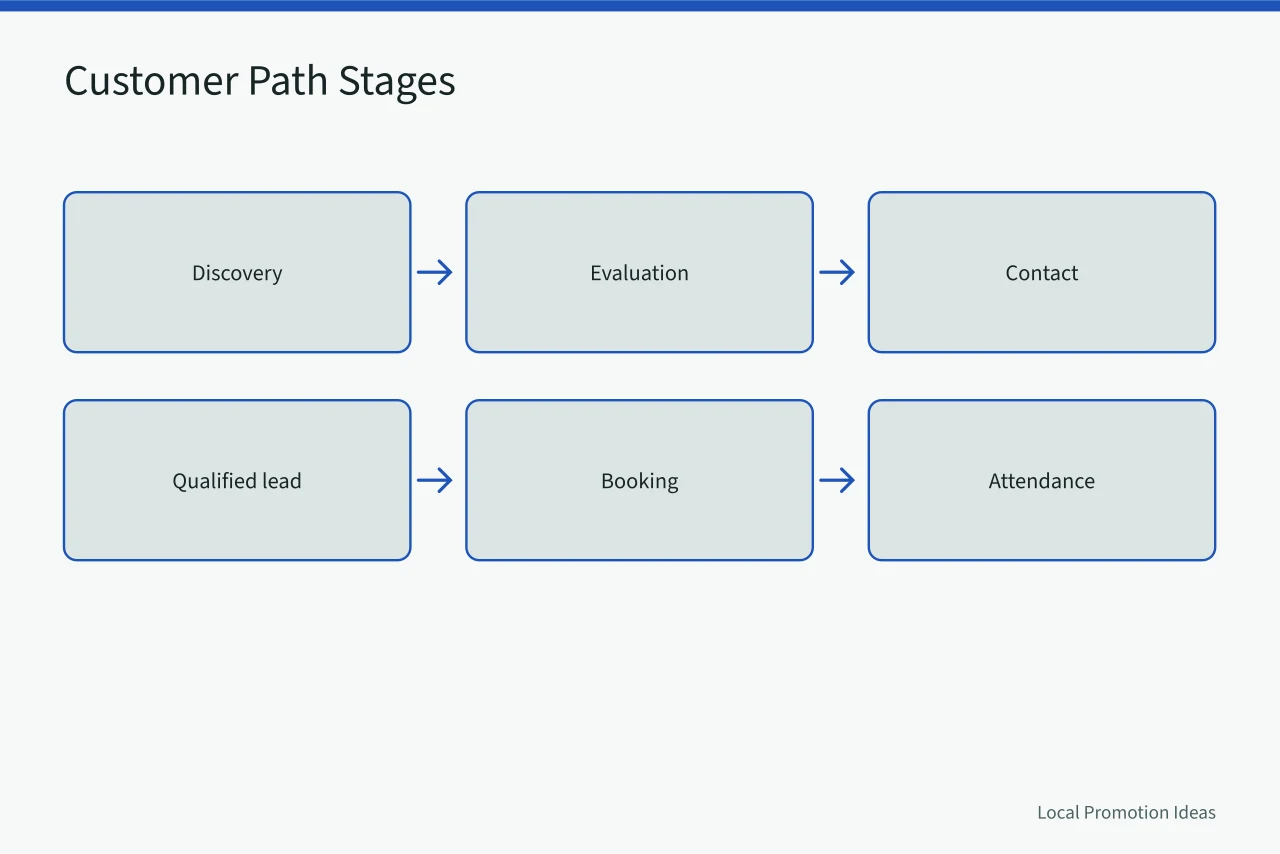
Then count how many people sit at each stage and how long they stay. The gaps tell you where to spend. A shop with strong discovery and weak attendance has a reminder problem, not an advertising problem.
4. Check the economics, not just the conversion
Compare total channel cost against verified customers, not platform-reported ones. Then subtract refunds, fees and service burden to get contribution.
Track payback and repeat contribution separately. A channel that wins cheap first orders and no second ones is renting customers. Give attribution a range when the evidence is incomplete, and say so in the report.
5. Check quality and capacity guardrails
Watch response time, appointment wait, stock availability and returns. Track cancellations, complaint themes, staff workload and unresolved work.
A channel should stop scaling when either guardrail slips. Growth that outruns the counter or the van shows up later as refunds and one-star reviews.
6. Check the baseline period
Use at least one representative sales cycle. Mark promotions, outages, seasonal events and any change in how a metric is defined, so a later reader knows what moved.
Report medians or ranges when a few large orders distort the average. Set one improvement goal and one guardrail for each 90-day test.
7. Check the definition sheet
| Measure family | Useful view | Required companion |
|---|---|---|
| Demand | Qualified inquiries, bookings, first sales | Fit and source confidence |
| Economics | Contribution, acquisition cost, payback | Cash and service burden |
| Quality | Wait, delivery, returns, complaints | Customer and staff context |
| Learning | Baseline, test effect, guardrail, decision | Seasonality and limitations |
A small business marketing strategy checklist ties each row to the decision it feeds, so nobody maintains a number that changes nothing.
8. Check the evidence behind the comparison
The GAO evaluation design guide pairs evaluation questions with the evidence and design each one needs. Federal guidance does not make a local marketing result causal or transferable, but the discipline transfers.
The NIST experimental design selection guidance starts design choice with the objective and the practical constraints. Use it to keep observation and controlled effect estimates in separate columns.
Before trusting any benchmark, write down the small business marketing strategy questions your team needs answered about customers, channels and budgets. Review operating signals monthly and economics quarterly with the owner and a financial adviser.
A documented small business marketing strategy beats a percentile, and a budget decision is the only proof a benchmark did any work.
Common questions
What makes a small business marketing benchmark useful?
It is stable, defined locally, and tied to a decision you were already going to make. Interpret it with customer, cost, quality and capacity evidence beside it. Add seasonality and source confidence.
Should a business copy an industry average?
No. Check the population, the definitions, the period and the exclusions first. Then set local targets from your own economics and operating limits, and treat the average as background only.
How long should a baseline run?
At least one representative sales cycle, with promotions, outages and seasonal events marked. The right period depends on how often customers buy and how much the numbers move.